
Elliott Wave: building scenarios
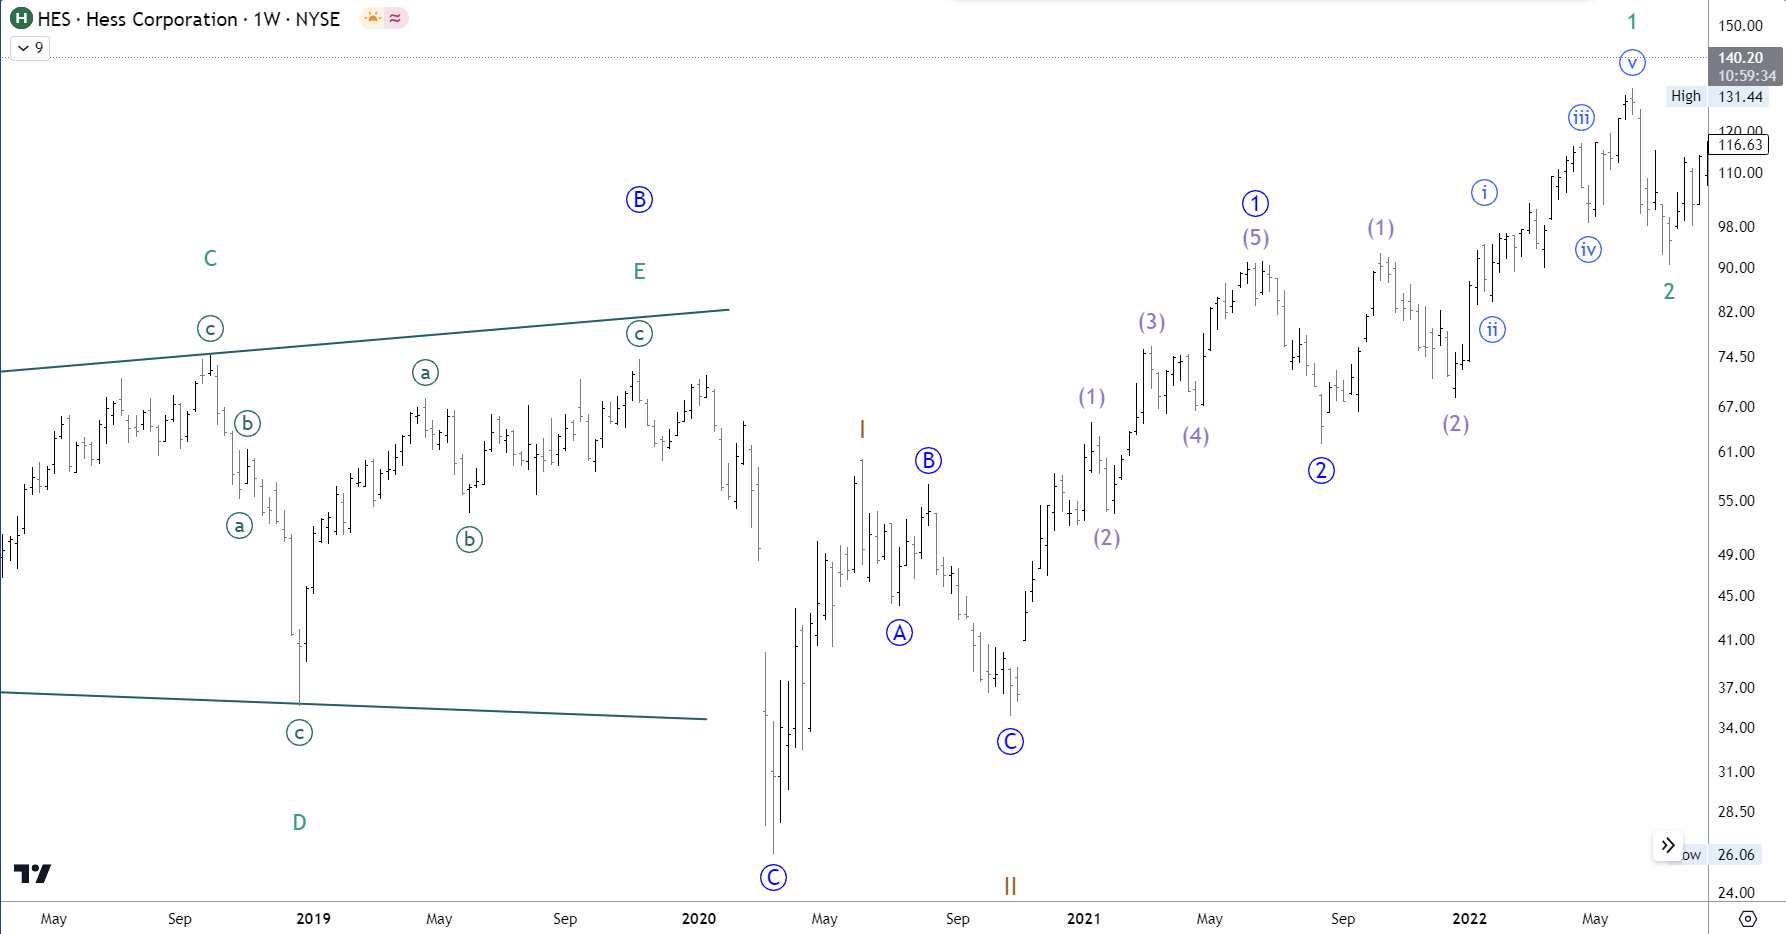
I use waves to place a move within a broader structure. A multi-timeframe reading helps distinguish the main scenario from its alternatives. A wave count remains a hypothesis, with an invalidation level.
MY METHOD
Read the structure, test your assumptions and define an invalidation level before taking action.
THE PROCESS
Prepare.
Observe.
Manage.
I use waves to place a move within a broader structure. A multi-timeframe reading helps distinguish the main scenario from its alternatives. A wave count remains a hypothesis, with an invalidation level.
A candle is never read in isolation. Its position, nearby levels and the sequence that precedes it give the signal its meaning. I look for consistency between the context and the observed reaction.
Studying price and volume helps form hypotheses about accumulation, distribution and trend transitions. These observations complement my wave reading.
Before an entry, I define the scenario, its invalidation and the accepted risk. The trading journal is then used to review decisions, including when a scenario does not play out.
EDUCATIONAL TOOL
Compare a theoretical risk with a profit target. The ratio alone measures neither the probability of success nor the quality of a trade.
Break-even win rate: 33.3% before fees.
Simplified example: constant gains and losses, excluding fees and slippage.
Hi there 👋
How can I help you today?
Back on Mon, Oct 5, 2:30 pm
No result. Ask me directly via the live chat or the buttons below.
Quick links
If WhatsApp did not open the chat, search for my username @ChartXFlow (copied) in WhatsApp (new chat).
You can explore active trials access offers (like the $7), on the page : Newsletter Plan. If you need help enrolling or a direct trial link.
You can explore active trials access offers (like the $7), on the page : Newsletter Plan. If you need help enrolling or a direct trial link.